Will house prices fall by 20% or more, as many pundits are predicting? Those predictions go against the historical record and against economic reasoning. It is more likely that house prices will suffer single digit percentage falls, and then remain flat (in real terms) for an extended period of a decade or more.
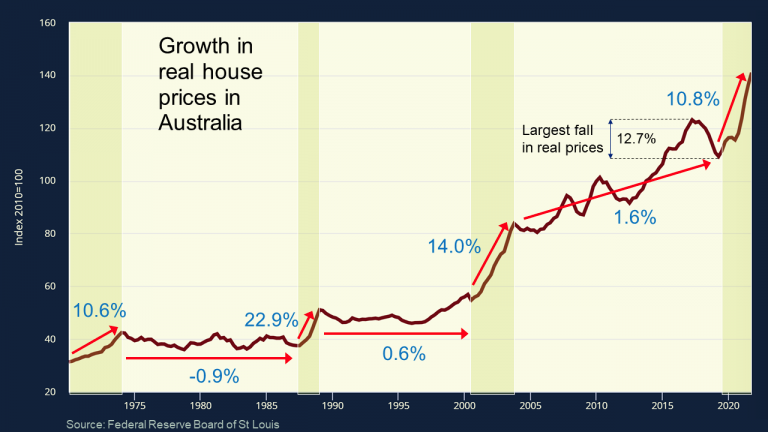
The graph below shows real (inflation adjusted) house prices in Australia from the beginning of 1970 until the end of 2021. There is an obvious pattern in the graph of house prices zooming up and then staying flat for a long period of time. That pattern is not just an accident of the data; it occurs for a particular economic reason, and the same pattern occurs in other countries. House prices in Canada, for instance, follow a strikingly-similar pattern.